
I joined the lab of Climate Change and Soil Biogeochemistry group at the Department of Agriculture, at Tennessee State University on January 13th, 2020. One of my goals for graduate school was to learn R programming language for statistical computing and data analysis. Since I joined my research group, I joined the lab of Climate Change and Soil Biogeochemistry group at the Department of Agriculture, at Tennessee State University on January 13th, 2020. One of my goals for graduate school was to learn R programming language for statistical computing and data analysis. Since I joined my research group, I have engaged in various laboratory assays relevant in my field of interest, which focuses on the impact of global warming on soil microbial processes. Based on the data collected from the experiments I conducted, I had to carry out data analysis using a statistical package to draw relevant conclusions from the experimental data. Statistical packages such as R project, SAS, SPSS, etc. help in the analysis, interpretation, and visualization of data. Thus, this month I learned how to write codes in the ‘R project’ for statistical analysis and data visualization. Specifically, I learned how to conduct a repeated measure analysis of variance (ANOVA). A repeated measure ANOVA is suitable for studies that investigate either changes in mean values over three or more time points and/or differences in mean values under three or more varying conditions.
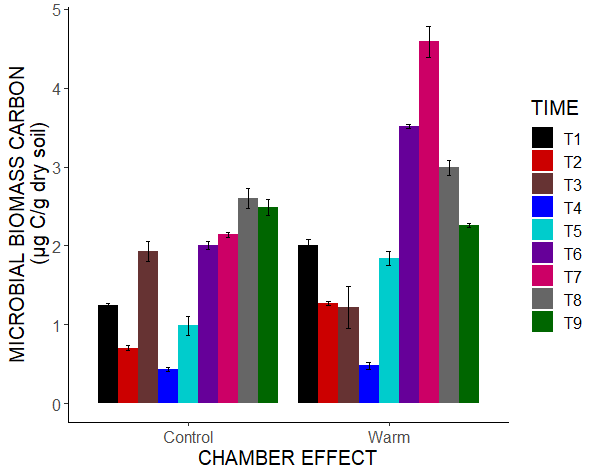
Considering that I had no prior programming experience in R, I was initially overwhelmed by the number of resources online and did not understand how to use the R project software for statistical analysis. However, with a continuous study of resources and surfing of the internet for relevant materials to aid my learning process. I found the following weblinks and YouTube videos very helpful. If you are new to the R programming language, I encourage you to subscribe to “Statistics of Doom” YouTube channel, the channel contains a lot of resourceful videos. Also, I found the following websites to be very helpful; https://www.r-bloggers.com/how-to-learn-r-2/ https://rcompanion.org/handbook/I_09.html https://stats.idre.ucla.edu/r/seminars/repeated-meaures-analysis-with-r/ and https://osf.io/dnuyv/ with the knowledge gained from using the above resources, I successfully analyzed my data and generated a graph similar to the graph below for my lab group presentation.
Let me know if you find this resource helpful. If you have any other additional resources that can help learn the R programming language, do let me know in the comment section.
